Overview:
Suppose monochromatic light is incident on a circular obstruction, such as a ball bearing. In the center of the shadow cast by the obstruction, a bright spot (Poisson's spot) as well as surrounding annuli, are produced by diffraction effects. Ignoring an overall scale factor, the intensity of this spot and its surrouding brights rings is described by:
where d is the diameter of the circular obstruction, r is the radial position on the viewing screen, and z is the distance from the obstruction to the screen.
Goal of this Experiment:
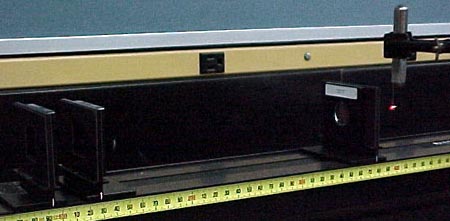
The goal of this experiment is to observe Poisson's spot and measure the intensity of the diffraction pattern as a function of position. A schematic and photograph of the set-up is shown below.
|
|
|
A photo of the set-up. The beam spreader and ball bearing hanging from a magnetized needle are pictured. |
|
|
|
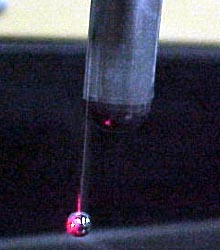
A close-up of the ball bearing hanging from the needle. |
Suggested Procedures:
Sample Data:
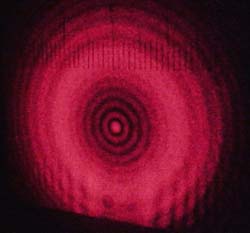
This photograph of Poisson's Spot had its brightness and contrast adjusted in NIH Image to make the bright and dark annuli clearer. The diameters of the annuli were measured (in pixels) using the Marquee Tool and the Info Window in NIH Image. A millimeter scale is visible at the top of the image which was used to determine the corresponding physical size the annuli. In the plot below, the bright and dark regions of the pattern are plotted (appearing as red and gray rectangles). A Bessel function, described by:
which was constrained to match only the center of the first dark ring, is plotted as well.
Questions: