Overview:
Suppose light is incident on two slits of width a and spacing b. The intensity of the pattern created by interference and diffraction is given by:
Goal of this Experiment:
The goal of this experiment is to measure intensity as a function of position of the pattern produced by interference and diffraction effects as light passes through a pair of slits. A schematic of the set-up is shown below.
The PASCO system has a slide with four pairs of slits with various slit widths and spacings. The motorized linear translator is shown below:
Suggested Procedures:
Sample Data:
A picture of a typical two-slit patter was taken with a digital camera:
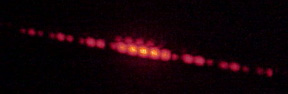
From this picture can you say something about the ratio of the slit-width to slit-separation ?
We used a diode laser to illuminate a two-slit aperture (slit-width of 0.04 mm and separated by 0.25 mm). A fiber optic cable attached to a photodiode connected to a Mac via ULI interface read out the intensity. The fiber was mounted in a motorized linear translator which swept the fiber along the "screen" or along the y-axis at 0.17 mm/sec. The slit to fiber-optic distance was approximately 108 cm. The ULI measures intensity vs time - use the velocity to convert to intensity vs distance.
The red points are the data and the dashed curve is the product of interference and intensity:
N = arbitrary normalization
a = slit width
d = slit separation
y measures distance along the "screen"
The only parameter varied to overlay the curve on the data was the normalization, N. Note that the overall size of the pattern in the central maximum (diffractive) region (11 peaks) was a little over 1.5 cm.
Eric Scott provided the fiber-optic system and Matt Bavender set up the optics to clean up the laser beam for this exercise. Alex Dzierba and Matt took the data.
Questions: