Overview:
Measuring the index of refraction of glass with reasonable precision can be a challenge. The index of refraction of ordinary glass is about 1.52. In this experiment we will be measuring the index of refraction of a type of lead glass which has an index of refraction of 1.62. So to distinguish between regular glass and lead glass we need to make a measurement which is better than a few percent.
Lead glass is so-called because the glass contains lead - as much a 50% of the weight of the glass is due to lead. The presence of the lead increases the index of refraction - which accounts for the attractiveness of lead glass, often used in fine 'crystal.' The glass is heavy because of the lead. Lead glass is used by our research group for electromagnetic calorimeters. High energy photons or electrons entering the glass produce a shower of electrons and positrons - most of which move travel faster than the speed of light in glass. This leads to another kind of electromagnetic radiation - Cerenkov light - which is detected by phototubes attached to bars of glass.
This experiment will study a bar of lead glass produced for us by what was then the Soviet Union. About 3200 such blocks were made for an electromagnetic calorimeter we built for a high energy physics experiment. The glass is precisely machined in the transverse dimensions. The transverse dimensions are 4 cm x 4 cm with a precision of +/- 50 microns (2 mils or 0.002 inches).
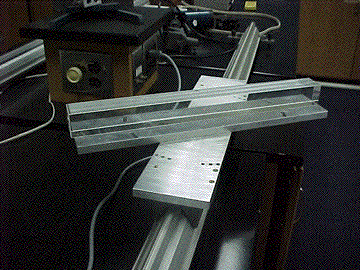
The photo shows a lead glass bar sitting on a special mount made by our machine shop. The mount sits on an optical bench and allows one to set the angle of the bar with respect to the axis of the bench.

Goal of this Experiment:
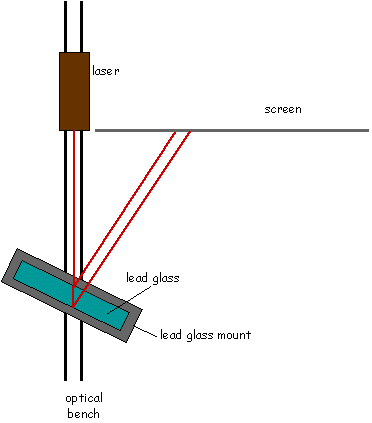
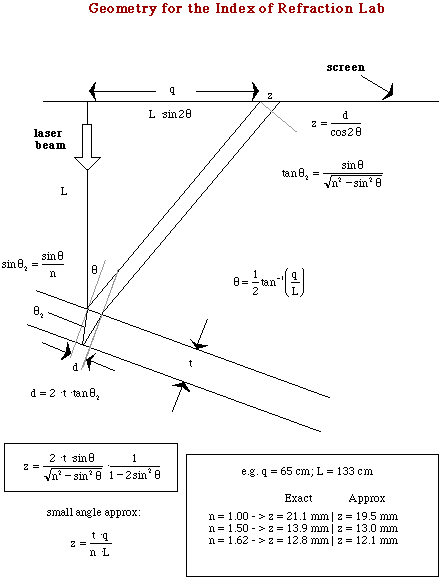
The goal of this experiment is to measure the index of refraction of lead glass by reflecting a laser beam off the front and back faces of the lead glass block. The two paths will result on two spots on a screen which is perpendicular to the beam as it emerges from the laser. The setup is shown in the cartoon drawing and the geometry is defined in the more detailed drawing below that. The challenge is an accurate measurement of the separation of the two spots and the distance of the spots along the screen.


Suggested Procedures:
Sample Data:
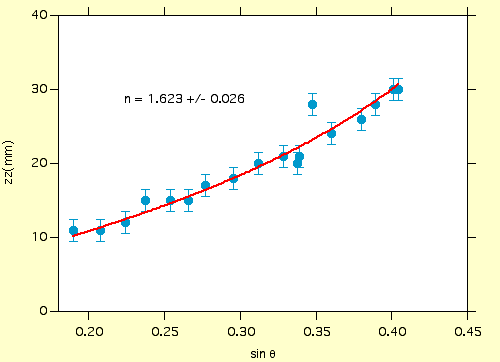
The plot below shows data taken with the setup of this experiment. The curve is a result of the fit to the function relating z to the sin of the angle of incidence on the glass block.

Questions: