| Energy Metering at Home | ||||||||||||
 |
||||||||||||
| Nothing like starting at home to look for ways to look for efficiencies and reducing energy use. I started by measuring our home electrical energy consumption. | ||||||||||||
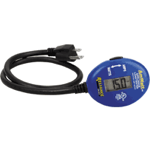 |
I bought a Reliance Amwatt appliance load tester to measure the power consumption of our appliances - the display show watts. The cost at our local home center is about $25. It is fine for measuring instantaneous power but to compute monthly or yearly costs to run the appliance you need to measure power as a function of time. | |||||||||||
 |
||||||||||||
| To measure appliance energy consumption as a function of time, I bought a power meter with data-logging capability called the Watts up? Pro from amazon.com. The meter costs around $120. User-specified data are stored in memory that can be read out via USB. PC-based software and drivers can be downloaded from the WattsUP meters website. The software displays data in graphical or tabular form and the latter can be saved as a delimited text file. I used IGOR to manipulate and plot data. | ||||||||||||
 |
||||||||||||
| Refrigerators
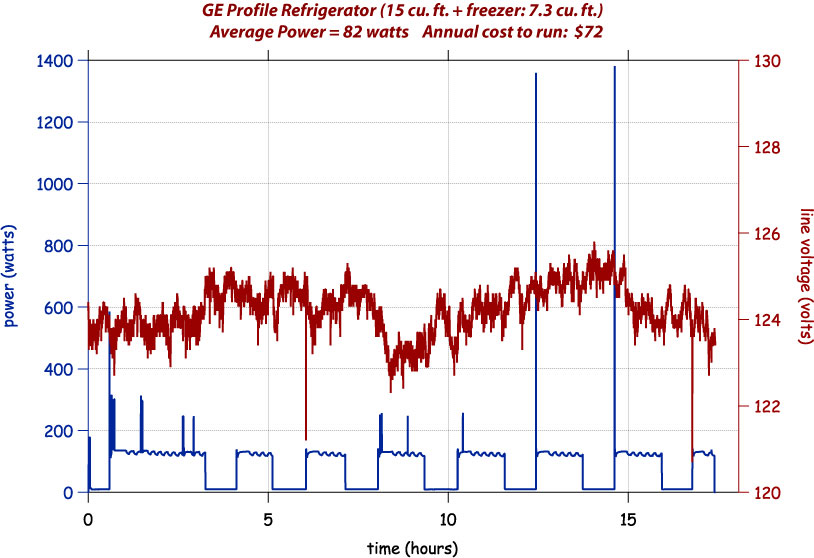
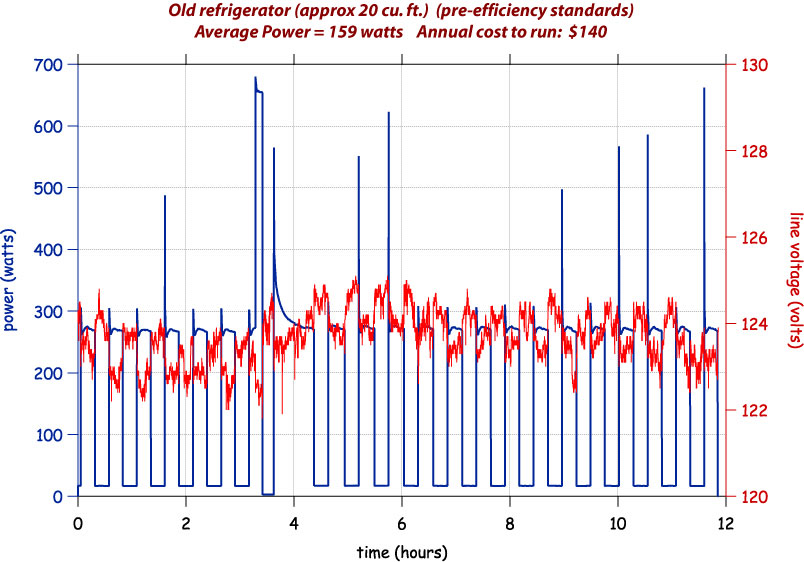
I compared the energy consumption our kitchen refrigerator, a GE Profile, with an older (pre-energy standards), slightly smaller refrigerator we use in our basement. The consumption per time (sampling every 5 seconds) for the GE is shown in the upper plot to the right. The small spikes in the plot correspond to opening and closing the refrigerator while the larger spikes are probably due to the automatic defroster. During the time that energy consumption was monitored for the older regrigerator, the doors on the refrigerator and freezer remained closed. The new refrigerator is a more than a factor of two more efficient. Although the newer refrigerator is more efficient, the average power of 82 watts is 50% higher that the manufacturer’s quoted 53 watts. Based on these measurements, we retired our older refrigerator. Our electricity supplier (Western Indiana REMC) charges $0.10/kW-hr. |
||||||||||||
 |
||||||||||||
 |
||||||||||||
| Reef Tank
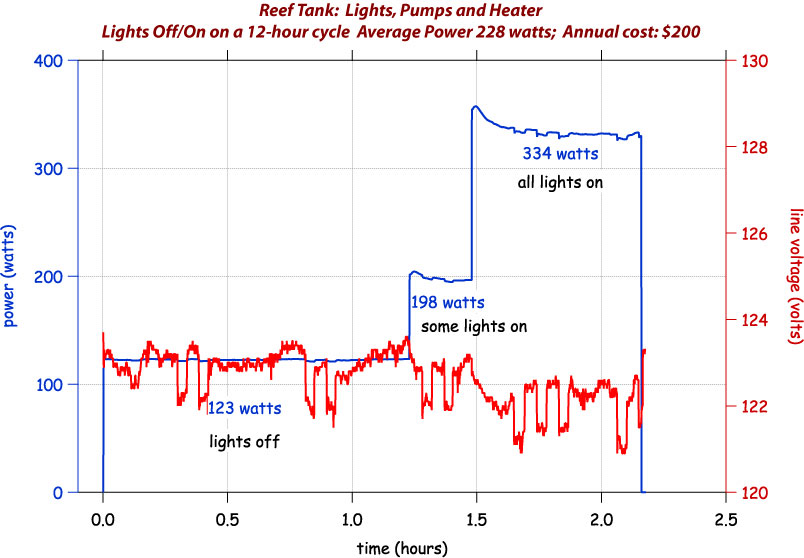
My wife, Linda, has a 75-gallon saltwater reef tank which has a controller for lights, pumps and heater. I measured the energy consumption for a 2-hour period during which the tank went from its night mode to day mode. You can see photos of the reef critters here. |
||||||||||||
| Total Power Consumption
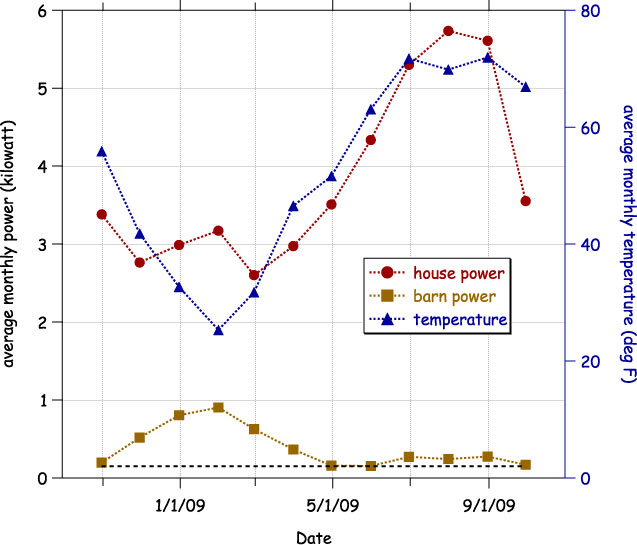
The graph to the right shows our total electrical power consumption per month starting in November 2008. The average monthly power is computed from the REMC monthly meter reading in kilowatt-hours divided by the number of days in the billing period times 24 hours/day. The house and horse barn are on separate meters. Use the left axis to read the power. Also shown is the monthly average of the mean daily outside temperature. These numbers were computed using the weather archives for the 47424 zip code from wunderground.com. Use the right axis to read the temperature. Note that the house power consumption tracks fairly closely with temperature from April through August. This is mainly driven by the air conditioner. We started paying attention to our energy use and in September we did not run our air conditioner so the monthly average power decreased from 5.7 kW to 3.5 kW. |
||||||||||||
 |
||||||||||||
| Note that the temperature shows a dip in July, compared to June and August but that is not reflected in our power. That's probably because our A/C was not being controlled by the thermostat but rather being set manually and we were being pigish. By comparison, our barn power did show a dip in July. The fans in our barn are themostatically controlled. The blacked dashed line for the barn is the contribution from the security lights at the barn. The barn power during the winter months is driven by heat lamps and heater tape for the waterer - that are also thermostatically controlled.
The increase in the power consumption for the house as the temperature dips during the winter months is likely due to the blowers for the furnace. We have a propane-fueled furnace. |
||||||||||||
| Total average power consumption: The power consumed, averaged over the year, is 3.8 kW for the house and 0.4 kW for the barn. How does 3.8 kW for the home compare to the average US household consumption?
Compared to national average: The DOE has residential energy consumption data for 2005 here and the relevant table is here. The average annual residential energy consumption per square foot in the Midwest is 46 thousand BTU/sq-ft. Our house is 3500 sq-ft. Converting 3.8 kW times 8760 hrs/yr to BTU divided by sq-ft, our consumption is 32.5 thousand BTU. However the national numbers take heating into account and this is not reflected in our number which only includes electrical consumption and not the propane we use for cooking and heating. More to come. Reducing our energy consumption: During the last few months we have been replacing all our incandescent bulbs with CFL's. I estimate that this will give us savings of 0.2 kW in our annual average. As a result of doing careful monitoring of our appliances, we discarded the old refrigerator and an inefficient de-humidifier for a savings of about 0.2 kW in our overall average. Our average power in winter is about 3 kW and during summer about 4.9 kW. If we were to reduce our A/C use by a factor of two we could reduce our average power by another 0.3 kW. Along with the other reductions we could reduce the 3.8 kW to 3.1 kW for an overall reduction by 20% with little effort. We are also reducing the barn power use average by 0.1 kW by removing a security light. What is the carbon footprint reduction by reducing by 0.8 kW? See our factoids page. In Indiana our power comes from coal. Each 1.0 kW over a year means burning about 5 tons of coal and dumping 15 ton of CO2 in the atmosphere. So going from 4.2 kW to 3.4 kW total (house+barn) would save 4 tons of coal and eliminate 12 tons of CO2. |
||||||||||||