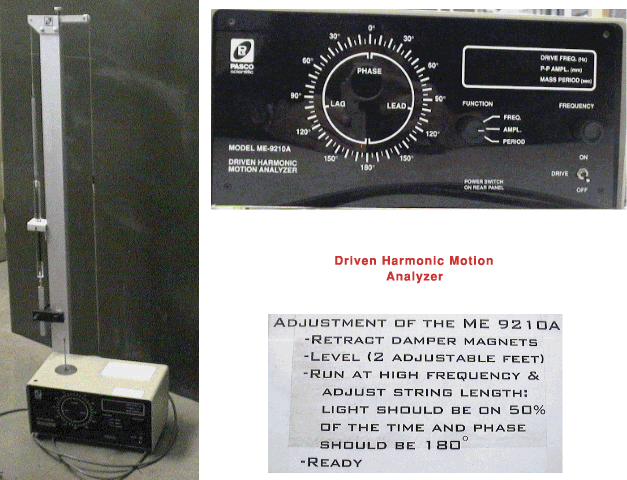
Overview:
In this lab you will analyze the motion of a driven harmonic oscillator. The apparatus is shown below. More details are given in the manual that comes with the apparatus. The goal of this lab is to collect data with the apparatus, mapping out the amplitude of oscillation and phase as a function of driving frequency.
Procedure:
- Become familiar with the apparatus - read the manual (several copies will be provided)
- Make sure the apparatus is aligned
- Determine the spring constant and the resonant frequency
- The value of the damping constant is set by adjusting the magnets. Determine the value of the damping factor for some setting of the magnets. Choose a value corresponding to small damping leading to at least 10 or more oscillations of the damped but undriven oscillator before the amplitude dies away.
- For this value of the
damping factor:
- Plot the amplitude of oscillation versus driving frequency
- Plot the phase angle as a function of driving frequency
- Plot the phase angle vs amplitude
- Using IGOR - plot the data and superpose the expected dependence (see below)
- Now increase the damping factor and redo the previous procedure (item 5)
Writeup:
- Include a brief discussion of the formulae relating amplitude and phase angle to driving frequency. You don't have to derive the formulae but you should explaing the variables.
- Briefly describe the alignment procedure.
- Describe how you determined the spring constant, resonant frequency and damping factor.
- Include your plots of data (use markers in IGOR) along with superposed curves.
- Write a summary of conclusions.
Background Information
The dependence of the amplitude on frequency is given by:
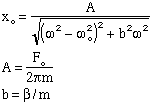
where we assume a driving force of amplitude Fo. The mass of the oscillator is m and the damping force is linear in velocity:
The phase angle between the driving force and displacement is given by:

David Howell and Parker Witmann made these measurements:
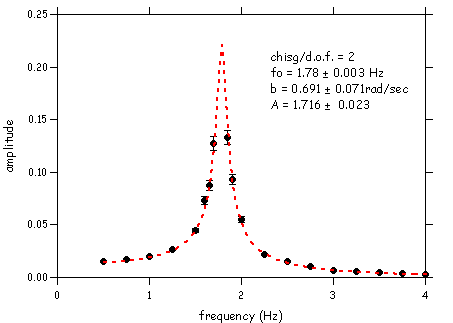
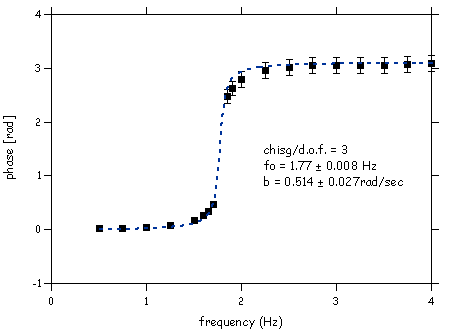
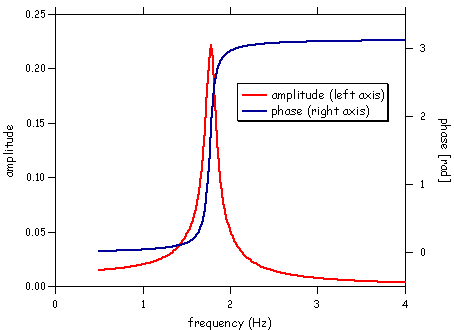
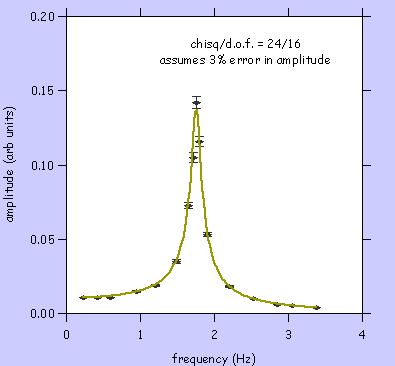
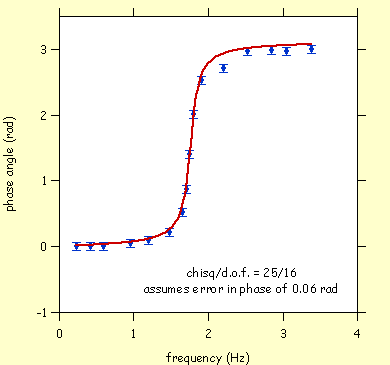
These plots were made with IGOR. When I analyzed the data I did a curve fit to the ampliture vs frequency and phase angle vs frequency dependences. The functions I used (in the Procedure window) are shown below. The results of the fits are shown in the plots.
Function/D amplitude(w, x)
Wave/D w; Variable/D x
return w[0]/sqrt(((2*Pi*x)^2-(2*Pi*w[1])^2)^2+(w[2]*2*Pi*x)^2)
End

Function/D angle(w,x)
Wave/D w; Variable/D x
return atan2(w[0]*x/(2*Pi),-x^2+w[1]^2)
End
These (very nice) data were taken by Eric and Kate - I helped with the analysis. I think we have handled the errors reasonably. The IGOR file () for these data and the fits: fhm.igor.hqx
Apparatus
(please see the manual for more information)
