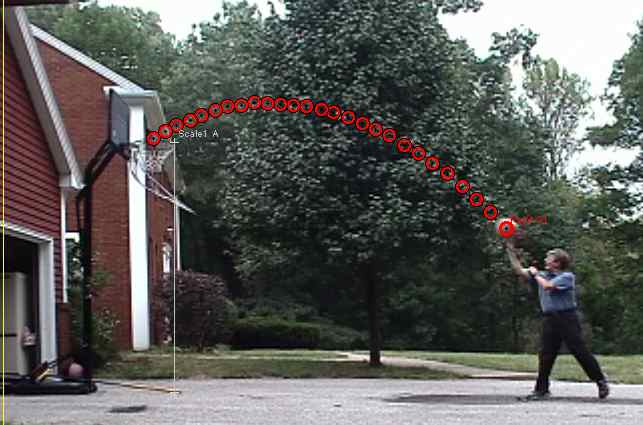
This is a movie of your favorite physics professor shooting a free throw at 4 pm CDT on 9/17/02. The red circles represent the digitization of the x-y position of the ball vs time. The time information is extracted from the movie file: larry_bird.mov
Using the VideoPoint program (on all the Macs in SW135) I digitized the above movie file. First thing to do is to define a length scale.
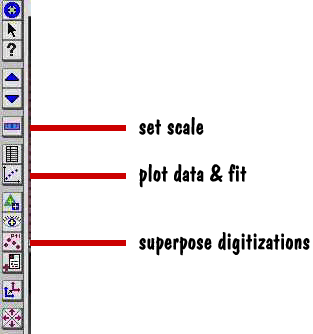
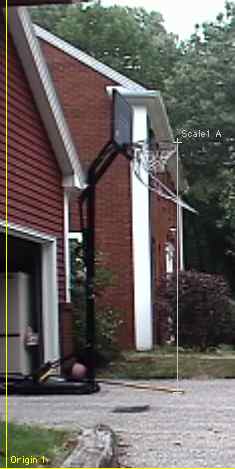
The set scale tool allows you to mark the end points of a known length to set the scale. In this case the distance between the hoop and the ground is 10 feet (regulation - of course).
The plot data tool allows you to plot and fit the data. For example:
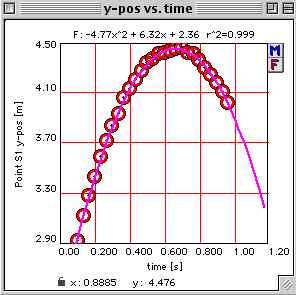
The vertical position vs time is shown above. The circles are the measurements and the curve is a result of requiring the best polynomial of order 2 that describes y as a function of time. The coefficient of the quadratic term (4.8 in this case) is 1/2 the acceleration or g/2. So in principle this gives us g in m/s^2.
The vertical velocity vs time gives:
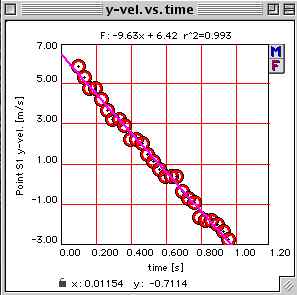
The points lie along a straight line whose slope is -9.6 m/s. Hmmm.....
And the y position vs x position looks like:
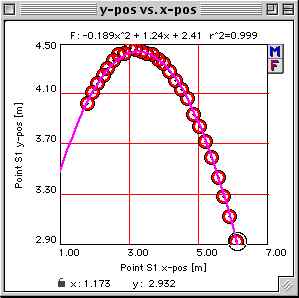
The fitted curve describes a parabola. What information is carried in the coefficients of the fit?
And finally, the data in the above plots is available in this Excel file that can be output from VideoPoint: vpdata.xls
Hey - Analyze This - movie to understand terminal velocity