Here is a set of drawings (cylinders.pdf) of the cylinders showing the construction including details of the endplate and the the inner rod. All dimensions are in inches. The material is aluminum.
First I will include the relevant IGOR files:
- solid cylinder: solid.igor.igor.hqx
- hollow cylinder: hollow.igor.igor.hqx
- hollow + shaft: shaft.igor.hqx
- mineral oil: oil.igor.igor.hqx
I will discuss the analysis of the solid cylinder where we know the moment of inertia and then use this to determine the angle of the incline. Using this information you can use the other IGOR files to determine b (see below) for the other cylinders. Note that the measurement of the small angle is problematic - which is why we use the solid cylinder data to determine the angle.
Procedure:
Use the value of the sine of the angle in the procedure below to determine b for the other cylinders.
Solid Cylinder Data and the Angle
First a reminder about the physics. The acceleration is given by:

Fitting the displacement vs time dependence will yield the acceleration. From a measurement of the acceleration and the angle one can in principle determine b but the error in the angle can be large. For example, if the angle is 1 degree, corresponding to 17 milliradian, then the sine of this angle is approximately 0.017. It is difficult to distinguish between 1 and 2 degrees given the level on the platform. So for the solid cylinder, where b = 1/2, we can use this information and the fitted value of a to determine:
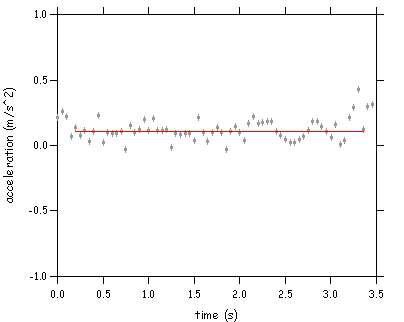
So below we show the determination of the acceleration for the solid cylinder based on distance vs time. We also show the consistency by fitting the velocity vs time (linear fit) and acceleration vs time (should be constant). We get a = 0.11 m/s^2.
Now for the energy plots.
The total energy is the sum of the PE + translational KE + rotational KE. This is:
which can be also written as:
When plotted vs time this should be a horizontal line (constant). But we don't know the mass - but this doesn't matter since:
should also be a constant with time. What is h? If xL is the value of the position along the ramp at the bottom of the ramp and x is the position at any time then:
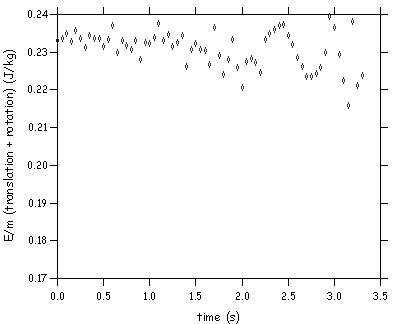
If we take both translational and rotational energy into account we have:
and using the value of acceleration (a) from the fits we have:
where b = 1/2. If we ignore the rotational energy then:
For the solid cylinder data we had xL = 1.885 m and the acceleration = 0.112. We show the fits and plots of energy/mass:
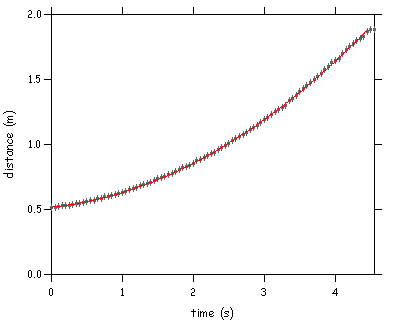
For the above fit the coefficient of the quadratic term is 0.05554. Now follows velocity vs time:
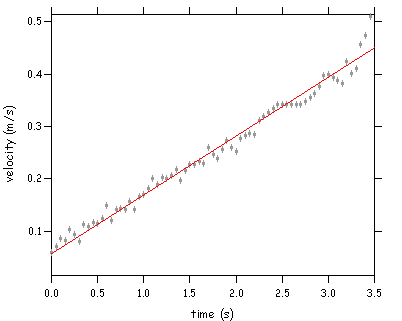
From the above fit the slope is 0.11242. Now we show this value on the plot of accelertaion vs time:
Now we plot the energy/mass vs time without the rotational term:
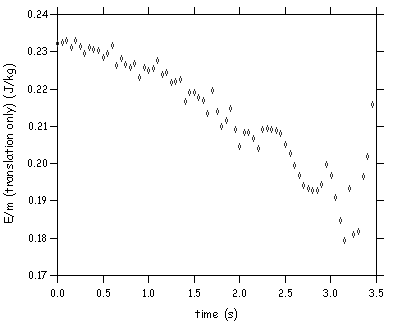
Clearly this quantity is not conserved - but if we add the rotational term it is:
